
Pay to Win in the MLB
The phrase “pay to win” suggests that the more a team spends on its payroll, the more it will win. The financial structure of Major League Baseball (MLB) contains a luxury tax placed on teams that have a payroll of more than $210 million as of 2021. Though this is not a salary cap, many teams operate as if it is. However, for some teams, in order to sign superstars or even just to keep their players, they have to get close, or even sometimes exceed the $210 million mark. Many consider this to be unfair because many teams in small market areas are unable or unwilling to spend this much money on players. This article will evaluate whether the “pay to win” motto has applied to the last ten seasons of the MLB by using a mathematical regression.
Many fans seem to think that throwing blank checks at players is the way to end championship droughts. However, teams have become successful without spending above the league average of 130.4 million. This is best exemplified by teams like the Atlanta Braves, Cleveland Guardians, Houston Astros, Milwaukee Brewers, Oakland Athletics, and the Tampa Bay Rays. These teams are either managed by frugal owners or do not physically have enough money. Over the last ten seasons, these six teams have been able to spend below the average payroll and win more games than the league average. However, there could be many explanations for why these teams have had success in the regular season. Drafting top-tier players, developing young players into superstars, and trading for talented players all limit spending while increasing the quality of a team. Having good international and intranational scouting departments is pivotal for teams that are incapable and unwilling to spend an immense amount of money.
Some teams spend money but are not rewarded with wins. Teams like the Detroit Tigers, Texas Rangers, Toronto Blue Jays, Philadelphia Phillies, and the New York Mets have spent over league average while their wins over the last ten seasons have been below average. These teams have owners who are willing to spend a lot of money but have not used these resources in ways that led to team success. This manifests in many ways–guaranteeing players large contacts that end poorly due to injuries, or underperforming players. These contracts can restrict teams because they are spending money on players that don’t raise the quality of their team.
In order to determine the relationship between payroll and wins, I created a data set with payroll and win totals. This data set includes different variables that can attest to a team’s market size–a city's population, median household income, average payroll, and owner net worth. I chose to include a city’s population because stadiums located in densely populated areas are more readily accessible, leading to higher ticket sales and more revenue. Median household income surrounding a team’s stadium is also a variable that could explain why a team would be willing to spend more. To determine the effect a large payroll has on wins it is best suited to run a regression. A regression equation with one constant is defined as
Yi = β0(Intercept) + β1X1i + β2*X2i+Ɛi
In this equation, Yi is the dependent variable (regwins), X1i is the independent variable (payrollm), X2i is the constant(avgattendance) and Ɛi is the random variable term. While those were the main variables, exploration led to the use of more variables in the equation. On top of the main equation, it was most beneficial to regress five other variables in order to get the most refined results. These variables included regular season wins, city population, median household income, average payroll, and owners' net worth. With the addition of new independent variables the equation changes.
Yi = β0(Intercept) β1*X1i + β2*X2i + β3 *X3i +β4 *X4i +Ɛi
In this equation, the dependent variable, Yi is still regular season wins(regwins), and one of the independent variables, X1i is still average payroll(payrollm). The new independent variables are defined as the following, X2i is city population(citypop), X3i is median household income(householdincome), X4i is owner net worth(ownernetworth), and X5i is still the constant of average attendance(avgattendance) with Ɛi still being the random variable term.
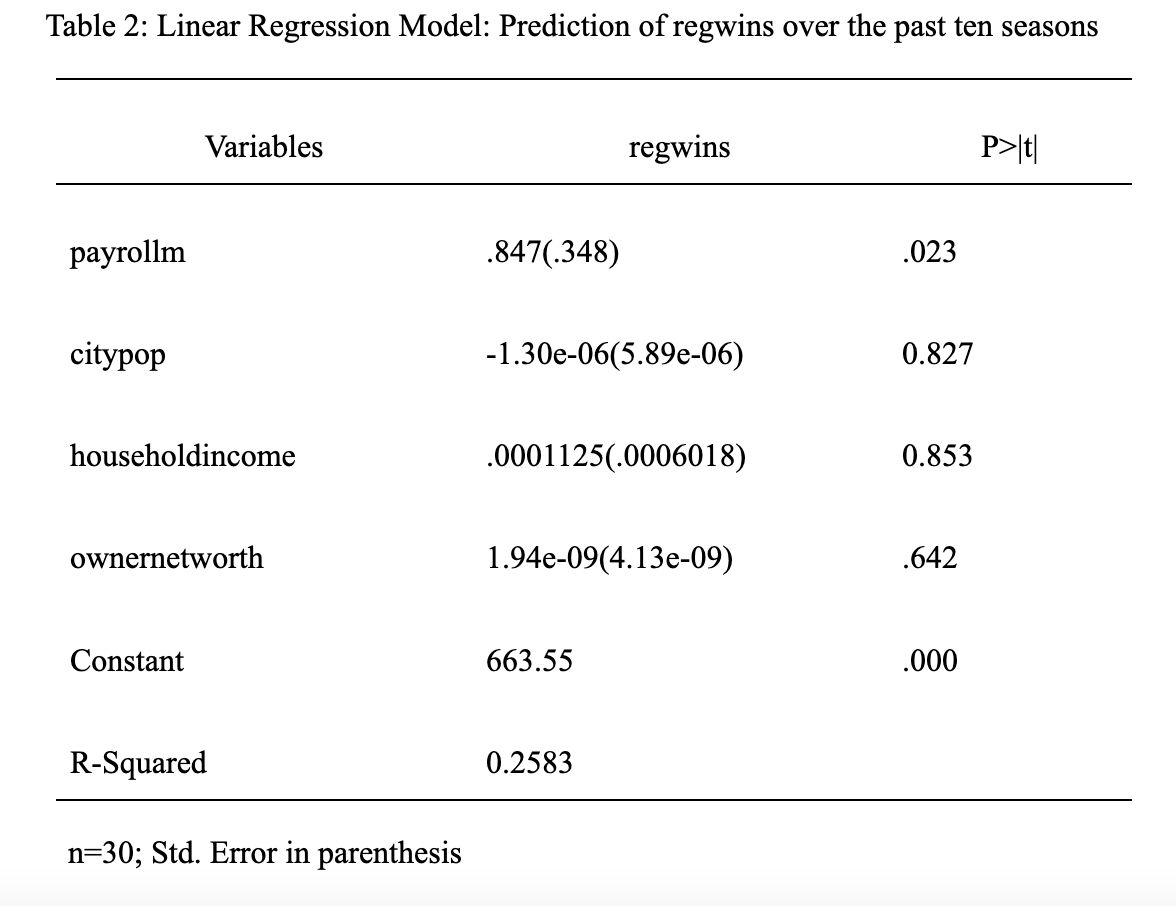
For this research question the confidence interval was set at 95%. The results from the regression model only show one statistically significant variable. The variable that was significant on a .05 level was payrollm. The p-value for payrollm was .023 which is less than .05 but greater than .01. The variables citypop, householdincome, and ownernetworth all had p-values greater than .05 showing no statistically significant data. From this data, I created a final regression model, Regular Season Wins= 663.55+0.847*Payrollm. This data conveys that when payrollm increases by one million, regular season wins increase by .847. This shows a positive correlation. R-squared is 0.2583, indicating that 25.83 percent of regular-season wins can be explained by payroll.
Using the regression model, Regular Season Wins= 663.55+0.847*Payrollm, it can be determined that in Major League Baseball, higher payrolls do not strongly correlate to more wins. This is determined because of a low R-squared of only .2853. In determining if spending more had a direct correlation with wins, I found four variables that I thought would show a strong correlation. While running a regression, that turned out not to be the case these variables were not statistically significant. The null hypothesis can be rejected because the p-value for payrollm is lower than .05. Though this shows that the variable is statistically significant, it is not strong enough to prove a direct correlation win team success.
Outliers can have a significantly large effect on a data set. Over the ten-season stretch that the data originated, several teams were outliers. These outlier teams are teams that are either from small markets and over-perform, or big market teams and under-perform. A team like the Tampa Bay Rays have a small market but have over-performed over the last ten years. The Rays have an average payroll of only $63,574,404 but they have accumulated 813 regular season wins over a ten year period, averaging 81.3 wins a season. There are also teams from big markets who spend a lot of money without success, the New York Mets for example. The Mets have the owner with the highest net worth in the league and they have had an average payroll of $110,592,429 but have averaged only 74 wins in that stretch of time. Outlying teams like this are the reason that there is not a stronger relationship between wins and market size.
Major League Baseball teams in big market areas do not have an unfair advantage because of their ability to have an increased payroll. Teams have developed ways through advanced scouting and metrics to consistently produce winning lineups. There has been a steady increase in funding towards not just players' salaries but research and development to find diamonds in the rough players. I will able to come to this conclusion using my equation running several regressions with data on major league teams from the years 2010-2021.
References
Akhigbe, Aigbe, Melinda Newman, and Ann Marie Whyte. “Is There a Differential Market Size Effect in U.S. Free Agent Signings? Evidence from Localized Sentiment Trading.” Journal of Sports Economics, 2021, 152700252110071. https://doi.org/10.1177/15270025211007193.
Bureau, US Census. Census.gov, December 16, 2021. https://www.census.gov/.
Depken, Craig A. “Free-Agency and the Competitiveness of Major-League Baseball.” SSRN Electronic Journal, 1996. https://doi.org/10.2139/ssrn.1711.
Drahozal, Christopher R. “The Impact of Free Agency on the Distribution of Playing Talent in Major League Baseball.” Journal of Economics and Business 38, no. 2 (1986): 113–21. https://doi.org/10.1016/0148-6195(86)90021-4.
“MLB Stats, Scores, History, & Records.” Baseball. Accessed December 19, 2021. https://www.baseball-reference.com/.
Orinick, Steve. “MLB Team Payrolls.” Major League Baseball Team Payrolls 1998-2021. Accessed December 20, 2021. http://www.stevetheump.com/Payrolls.htm#2019_payrolls.
“2010-2019 MLB Ballpark Attendance Figures, Ballparks of Baseball.” Ballparks of Baseball - Your Guide to Major League Baseball Stadiums. Accessed December 19, 2021. https://www.ballparksofbaseball.com/2010s-ballpark-attendance/.